Active cell phosphine generator SGF-M2 and fumigation technologies with its use
Phosphine Generator SGF-M2 is an independent physico-chemical system. The fumigant gas, phosphine, produced by the generator, is injected into the object of fumigation through tubing as a result of the chemical reaction energy and generated pressure. The total time of phosphine gas (80 g) development is 2 hours for each generator. Fumigation of grain in a silo with SGF-M2 was carried out without grain transfer using the natural convectional airstreams, driving the so-called "fumigation wave" - a high phosphine concentration region produced by the generator. The "fumigation wave" method allows reduction of the fumigant gas use and shortening the exposure time. Fumigation of grain in hopper cars with SGF-M2 takes 15 hours only.
INTRODUCTION
Traditional technologies of grain fumigation in silos are mainly based on application of tablet form preparations directly into the grain mass during the process of grain transfer from one silo bin to another. Such application procedure is labour-intensive, the gas development is slow, and the transfer operation damages the grain. The NPF SCARABEY's team has developed the new technical tool – the phosphine gas generator, SGF-M2, – and fumigation technologies for its use. The SGF-M2 generator consists of two interconnected chambers containing raw chemical components. When the reactants are brought into contact, parallel chemical reactions start, resulting in fumigant gas development, being a mixture of phosphine and carbon dioxide. At the result of the energy produced by these chemical reactions drives the fumigant gas into the object of fumigation through plastic delivery tubing. The approximate time of the fumigant gas development by one SGF-M2 generator is 2:00 hours with a yield of 80 g phosphine.
Fumigation technology based on the SGF-M2 use allows treatment of large volumes of grain without grain transfer. This technology allows simultaneous application of fumigant gas into all silo bins (including metal bins) possible. The fumigant gas rises through the grain layers by the convective airflow, ensuring layer-wise insect eradication, thus reducing both the gas usage rate and the exposure time.
Temperatures and humidities typical in hopper cars or ship's holds can result in slow decomposition of tablet formulations, which often result in low efficiency, high fire risk, demurrage and other financial losses. With SGF-M2 generators use, the fumigant gas can be applied within 2 hours.
MATERIALS AND METHODS
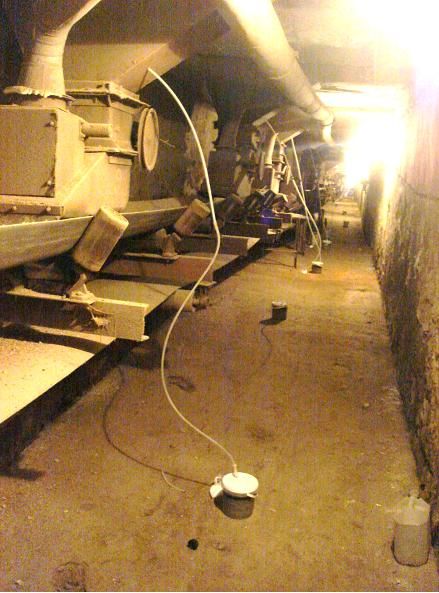
Three series of trials are reported here. In the first series, studies were conducted to determine the "fumigation wave" output peak time and value as determined by the grain height in a concrete silo bin. Wheat grain was stored in three 30 m high concrete silo bins, with a cross-sectional area of 9 m2. Silo bins were filled with grain to 15, 12 and 10.5 m high. The fumigant gas was applied from SGF-M2 generators to the bottom of each bin through the injection tubing at the dosage of 3 g m-3 (Fig. 1). The phosphine concentration in the grain mass was measured at 0.5 m depth from the surface of the grain, i.e. at approx. 14.5, 11.5, and 10 m distance from the gas injection point. The grain temperature during the study period averaged 21 - 22°C and the air temperature ranged from 9°C (night) to 15°C (day).
In the second series, fumigation was carried out in non-gastight metal silos with 27 m high walls, 3.5 m high cone bottom, 30 m diameter, containing 5000 tonnes of malt barley, occupying 5900 m3 of volume. Temperatures: air - 10-12°C (day), 3-4°C (night), grain - 17-22°C. The fumigant gas was applied through tubing to the air duct during the trial period of 5 days. Total of 160 generators (12.8 kg PH3, 2.15 g m-3 dosage) were used. Phosphine concentration measurements were taken at a depth of 1, 12, 24 m from the surface of the grain at 1.5 m and 15 m distance from the bin walls. The fumigation efficiency was determined by the mortality rate of Sitophilus granarius L. in bioassays located at check points.
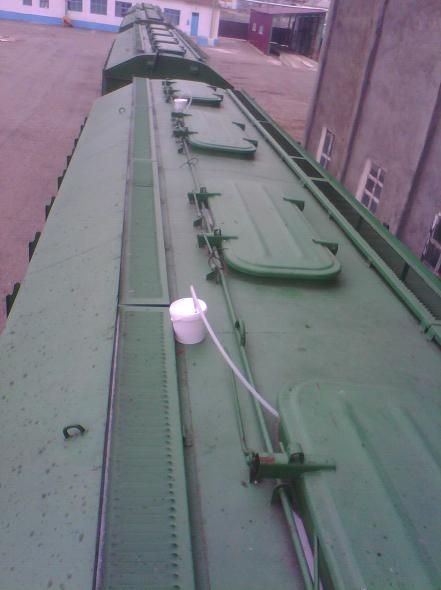
In the third series, studies were conducted to determine the time and efficiency of wheat (68 t) fumigation with generators SGF-M2 in a hopper car (Fig. 2). Two plastic tubes diam. 8 mm were introduced into the grain (through loading hatches #1 and #3) at approx. 1.8 m depth from the grain surface (Fig. 2). The injection time of 160 g of gas was 2:00 hrs. Grain temperature was 15 ° C. The air temperature ranged from 4°C (night) to 10°C (day). The exposure time was 15 hours. The time of passive degassing was 7 days. The fumigation efficiency was determined by mortality rate of S. granarius in bioassays located at check points.
RESULTS AND DISCUSSION
The results for the first series showed the "fumigation wave" peak time changed, depending on the height of the grain mass. Concentration readings, Table 1, show the peak at 36 hours for 15 m, 28 h for 12 m and 26 h for 11 m. The maximum phosphine concentration at the "fumigation wave" peak is 7.3 g m-3 at 15 m, 7.1 g m-3 at 12 m and 6.1 g m-3 at 10.5 m.
In the second series, 20 hours (five generators used, 400 g PH3 added, average dosage 67 mg m-3) after the first generator started, the phosphine concentration found at 1.5 m distance from the wall and at 1 m depth was 10 mg m-3, at 12 m - 60 mg m-3, at 24 m - 100 mg m-3, at 15 m distance from the wall at 1 m depth - 20 mg m-3, at 12 m - 90 mg m-3, at 24 m - 140 mg m-3. In 32 hours (eight generators use, average dosage 107 mg m-3) at 1.5 m distance from the wall at 1 m depth the concentration was 50 mg m-3, at 12 m - 90 mg m-3, at 24 m - 110 mg m-3, at 15 m distance, and 1 m depth - 90 mg m-3, at 12 m - 250 mg m-3, at 24 m - 400 mg m-3. The time of passive degassing was 30 hrs.
The research results for non-gastight metal silos fumigation show the ability to maintain the necessary phosphine concentration the grain mass during the process of fumigation. The fumigation efficiency, as bioassayed, was 100 %.
The observations in the third series are presented in Table 2. They show uniform phosphine distribution in the grain mass of the hopper car. The fumigation efficiency (bioassay) was 100%.
Table 1. The "fumigation wave" peak dependence on the height of grain mass in silo bins
|
Silo bin number |
Grain mass height (m) |
PH3 applied |
Check number |
Exposure time |
PH3 concentration (g m-3) |
PH3 max. concentration, (g m-3) |
|
1 |
15 |
315 |
1 |
15 |
0 |
7.3 |
|
2 |
20 |
0.1 |
||||
|
3 |
25 |
0.9 |
||||
|
4 |
30 |
3.6 |
||||
|
5 |
32 |
5.2 |
||||
|
6 |
34 |
5.9 |
||||
|
7 |
35 |
6.8 |
||||
|
8 |
36 |
7.3 |
||||
|
9 |
37 |
7.0 |
||||
|
10 |
38 |
6.1 |
||||
|
2 |
12 |
270 |
1 |
15 |
0.3 |
7.1 |
|
2 |
20 |
1.3 |
||||
|
3 |
25 |
5.4 |
||||
|
4 |
26 |
5.9 |
||||
|
5 |
27 |
6.6 |
||||
|
6 |
28 |
7.1 |
||||
|
7 |
29 |
6.7 |
||||
|
8 |
30 |
6.7 |
||||
|
3 |
10.5 |
225 |
1 |
15 |
0.6 |
6.1 |
|
2 |
20 |
2,8 |
||||
|
3 |
22 |
4,2 |
||||
|
4 |
23 |
5,0 |
||||
|
5 |
24 |
5,5 |
||||
|
6 |
25 |
5,8 |
||||
|
7 |
26 |
6,1 |
||||
|
8 |
27 |
5,7 |
||||
|
9 |
28 |
5,3 |
Table 2. Phosphine distribution in the grain mass in hopper car, showing fumigation efficiency on Sitophilus granarius mortality.
|
PH3 check point and bioassay locations |
Check time after first generator start (h) |
PH3 concentration, (g m-3) |
S. granarius mortality, % |
|
|
Before |
After |
|||
|
Grain mass at 0.1m, |
1 |
0 |
0 |
100 |
|
1.5 |
0.05 |
|||
|
2 |
0.15 |
|||
|
3 |
0.3 |
|||
|
4 |
0.7 |
|||
|
5 |
0.8 |
|||
|
9 |
0.8 |
|||
|
12 |
0.8 |
|||
|
14 |
0.8 |
|||
|
15 |
0.8 |
|||
|
Grain mass at 0.1m |
1 |
0 |
0 |
100 |
|
1.5 |
0.01 |
|||
|
2 |
0.4 |
|||
|
3 |
0.8 |
|||
|
4 |
0.8 |
|||
|
6 |
0.8 |
|||
|
9 |
0.8 |
|||
|
12 |
0.8 |
|||
|
14 |
0.8 |
|||
|
15 |
0.8 |
|||
Pic.1 Application of SGF-M2 phosphine generators to silo bins
Pic.2 Application of phosphine generator SGF-M2 to a hopper car through loading hatches #1 and #3